


MYFLEET
One portal where 500,000+ connected machines report in — fleet health, utilization, alerts and parts ordering designed around a single goal: uptime.
A portal built for uptime
MyFleet is the customer-facing platform of a global heavy-equipment maker — where construction and mining companies watch their fleets, catch problems early and order the parts to fix them. I led UX for the fleet-management experience.
The machines were talking.
Nobody was listening.
Every modern connected machine streams telematics — engine hours, fuel burn, fault codes, GPS. But for the people running mixed fleets across dozens of sites, that data lived in silos, and the daily reality was reactive: find out a machine is down when the operator calls.
Telematics in one portal, parts in a web store, manuals as PDFs, order status over the phone. A fleet manager’s morning meant four logins and a spreadsheet to stitch them together.
Fault codes and abnormality flags existed in the data — but reached no one in time. Machines failed in the field instead of being serviced in the yard.
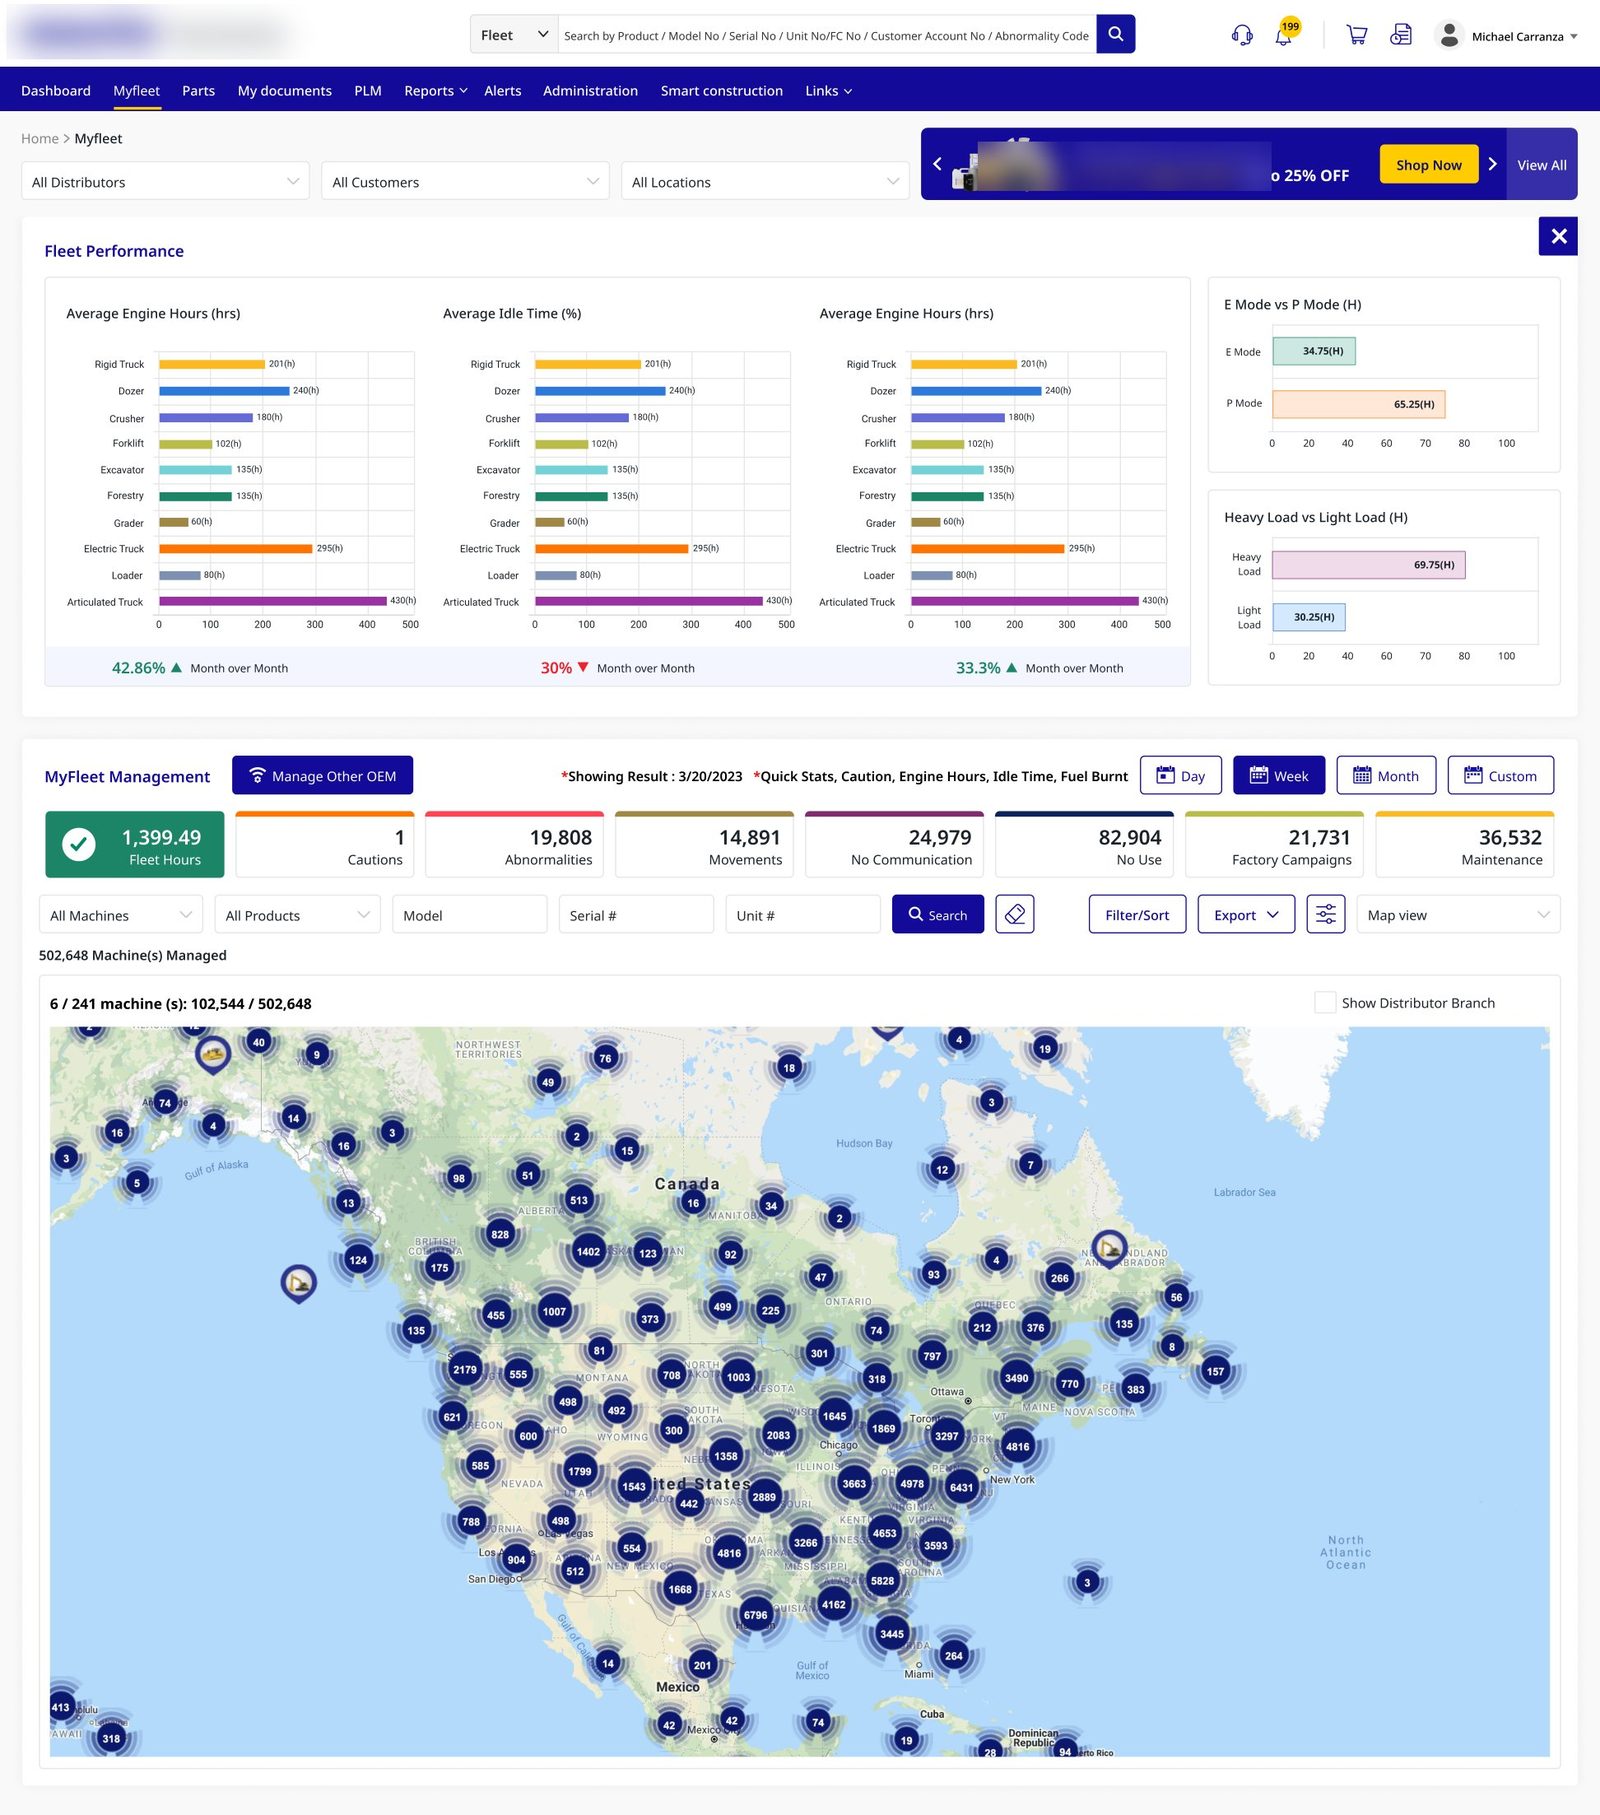
Real fleets aren’t single-brand. Without a way to register other-OEM machines, the “fleet view” was never actually the fleet.
Knowing a machine needs a filter and getting that filter were two different journeys. Diagnosis never connected to the order book, so distributors lost aftermarket sales to third parties.
In mining and construction, an idle machine isn’t an inconvenience — it’s thousands of dollars a day in lost production, penalties and re-scheduling. Every design decision on this project was priced against that number.
Downtime = the enemyThree seats in the control room
Discovery interviews and distributor ride-alongs kept surfacing the same three characters — each needing a different altitude over the same data.
Needs to know
- Which machines need attention today
- Where every unit is, and whether it’s earning
- What a repair needs — and how fast parts arrive
Blocked by
- Data spread across portals and phone calls
- Alerts that arrive after the breakdown
Needs to know
- Fleet health across every customer they serve
- Which machines are due for campaigns & kits
- Order and return status without inbox archaeology
Blocked by
- No cross-customer roll-up view
- Aftermarket demand invisible until it’s urgent
Needs to know
- Factory campaigns reaching affected serials
- Machines gone silent (no-communication)
- Adoption of alerts & reports across regions
Blocked by
- No feedback loop on which tools get used
- Escalations arriving as emails, not signals
Rules the interface had to obey
Half a million machines produce noise. Counters, colors and sorting exist to answer one question first: what needs me right now?
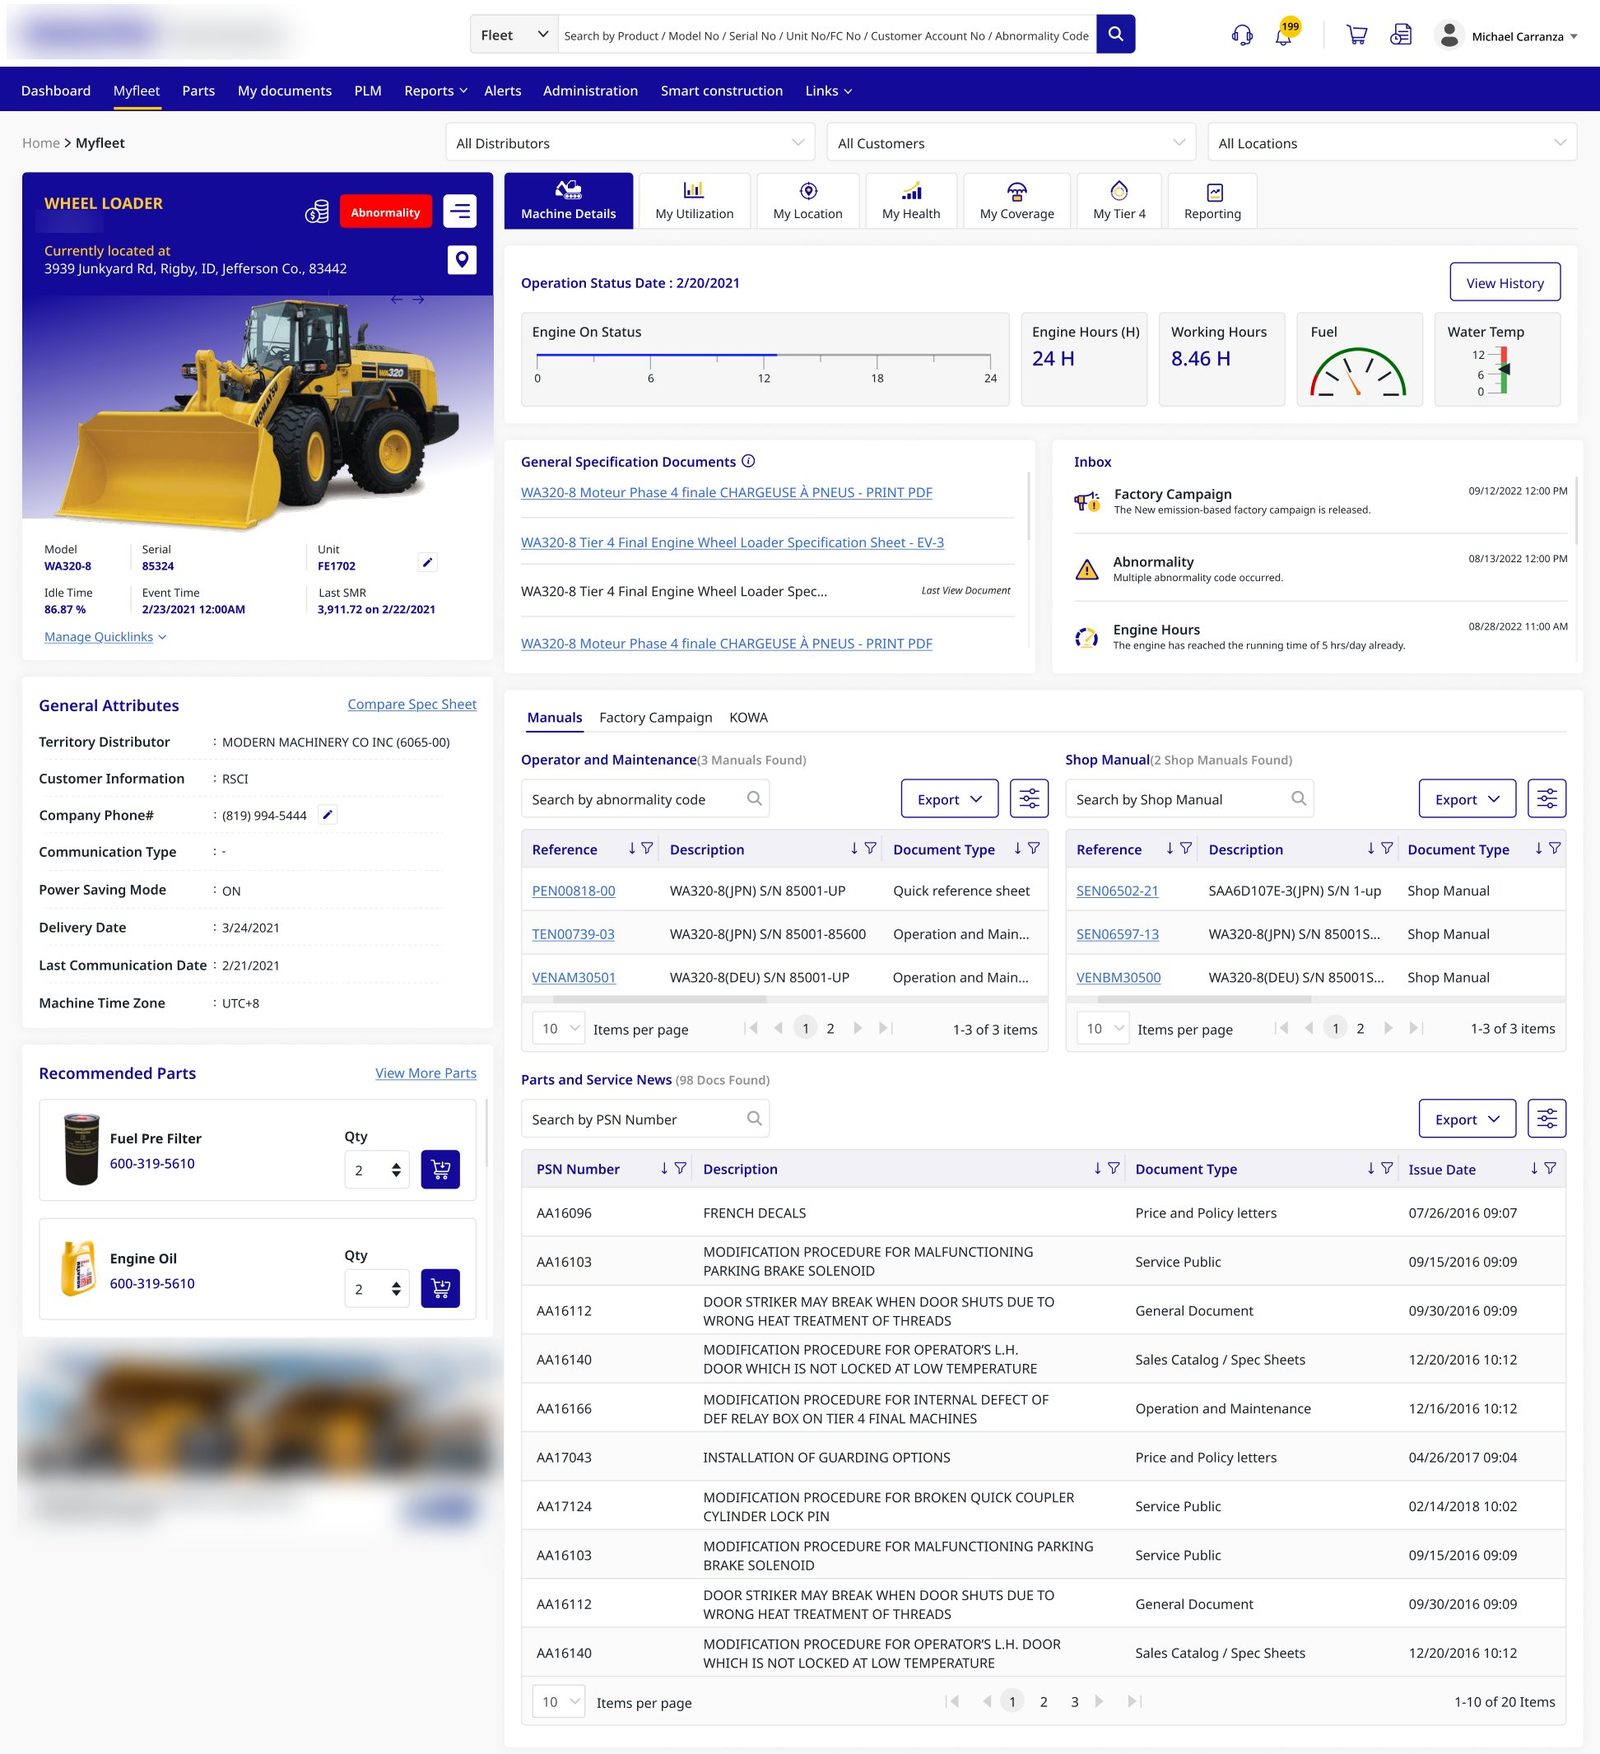
Location, vitals, history, manuals and parts belong on a single machine page — never five tabs in five systems.
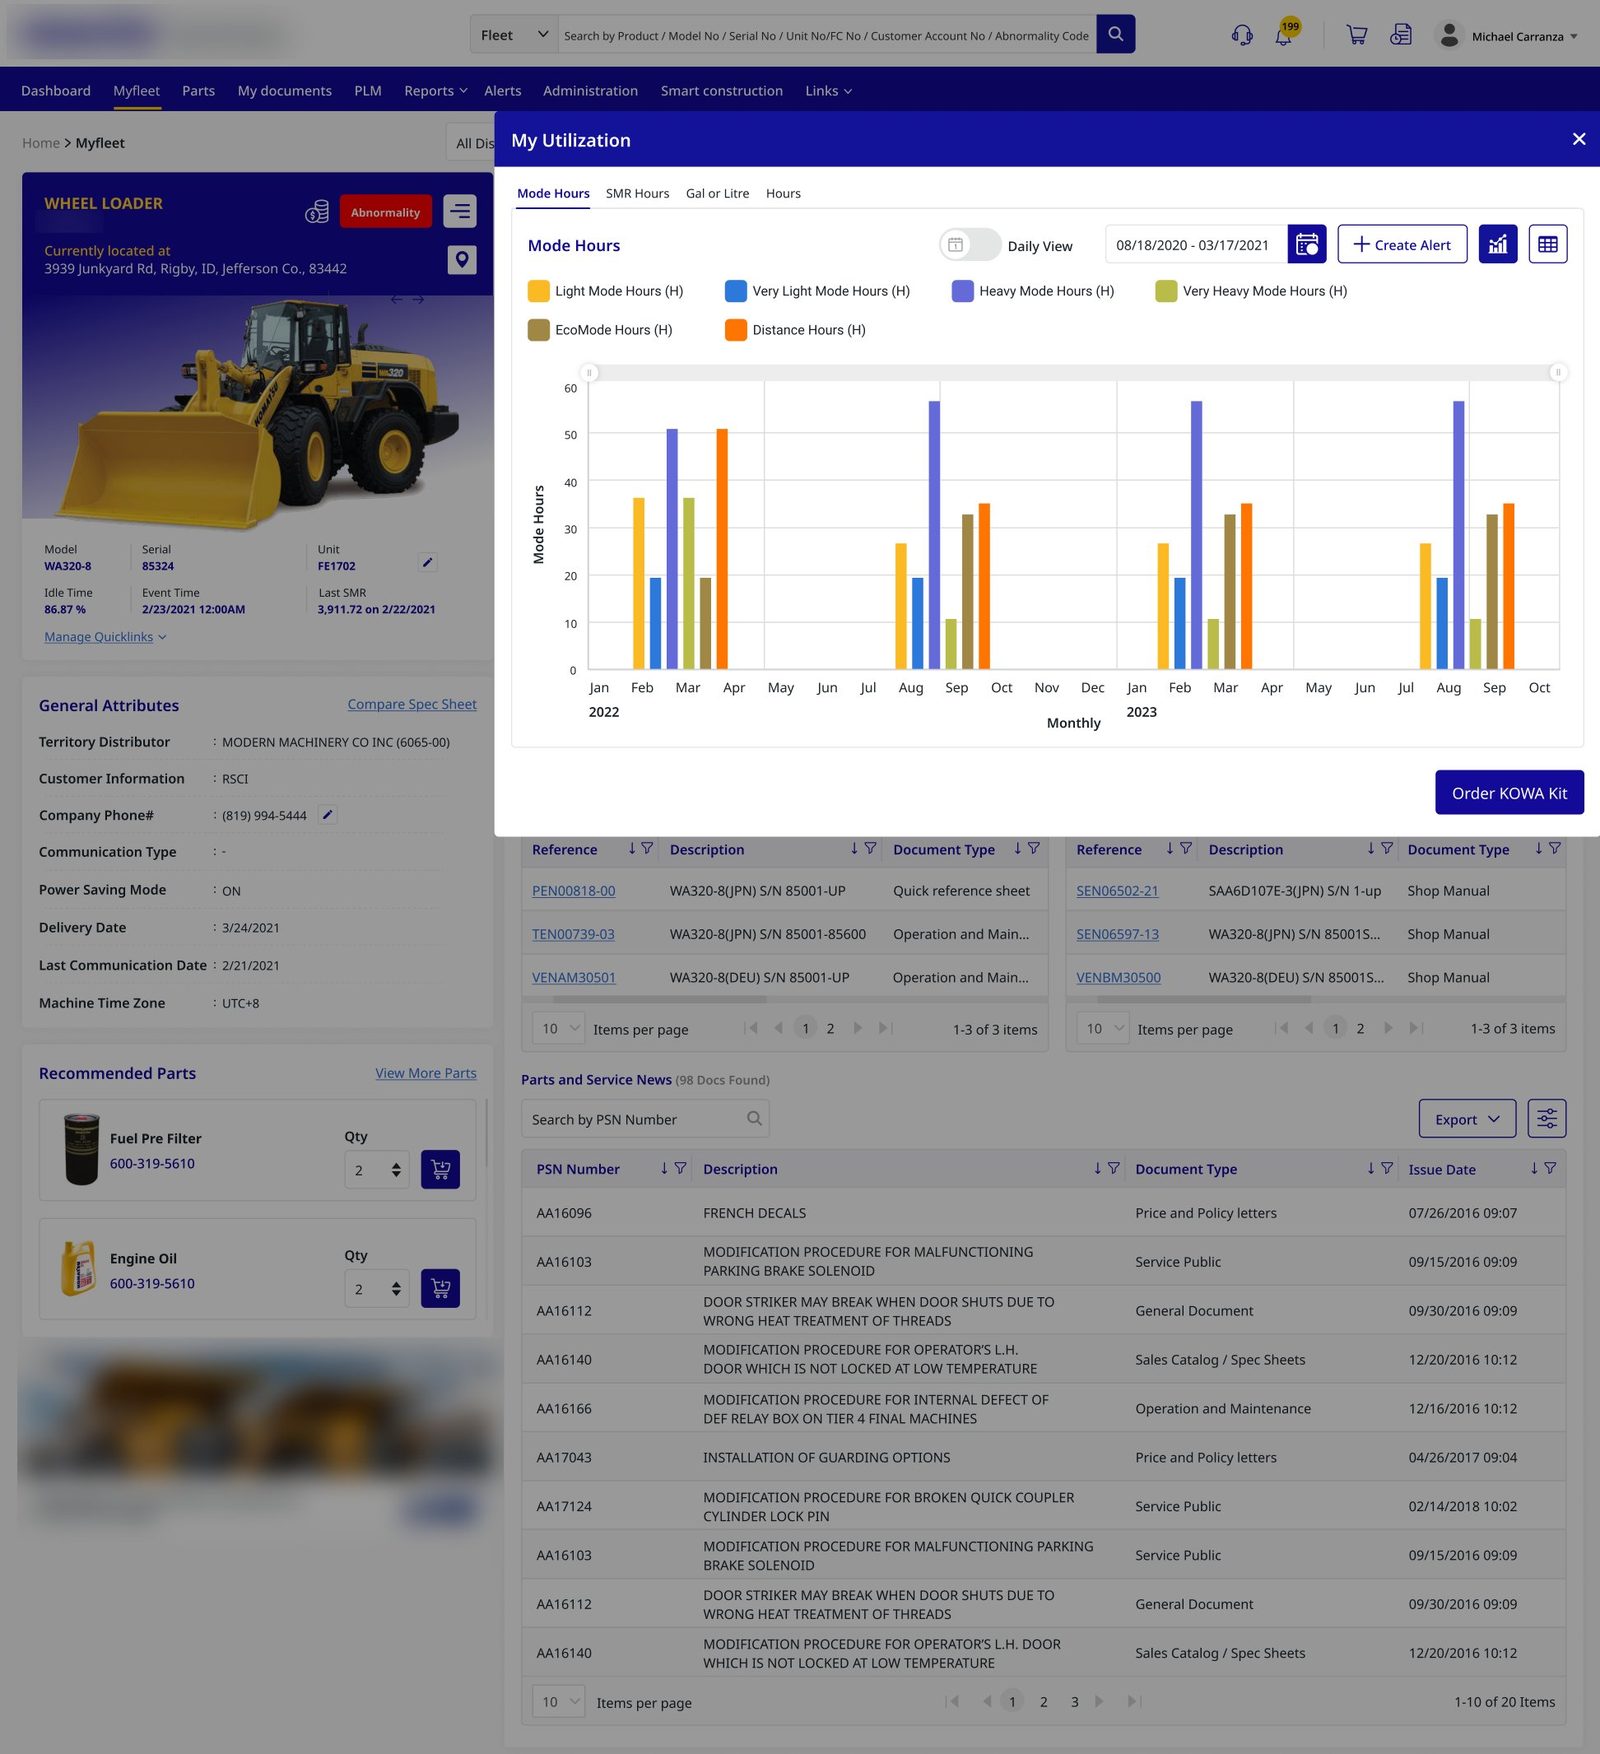
A chart you can only look at is a dead end. Analytics carry their own CTAs — create an alert, order the kit, schedule the report.
All-distributors → customer → machine uses one consistent drill pattern, so any role can zoom without relearning the UI.
Walking the platform, screen by screen
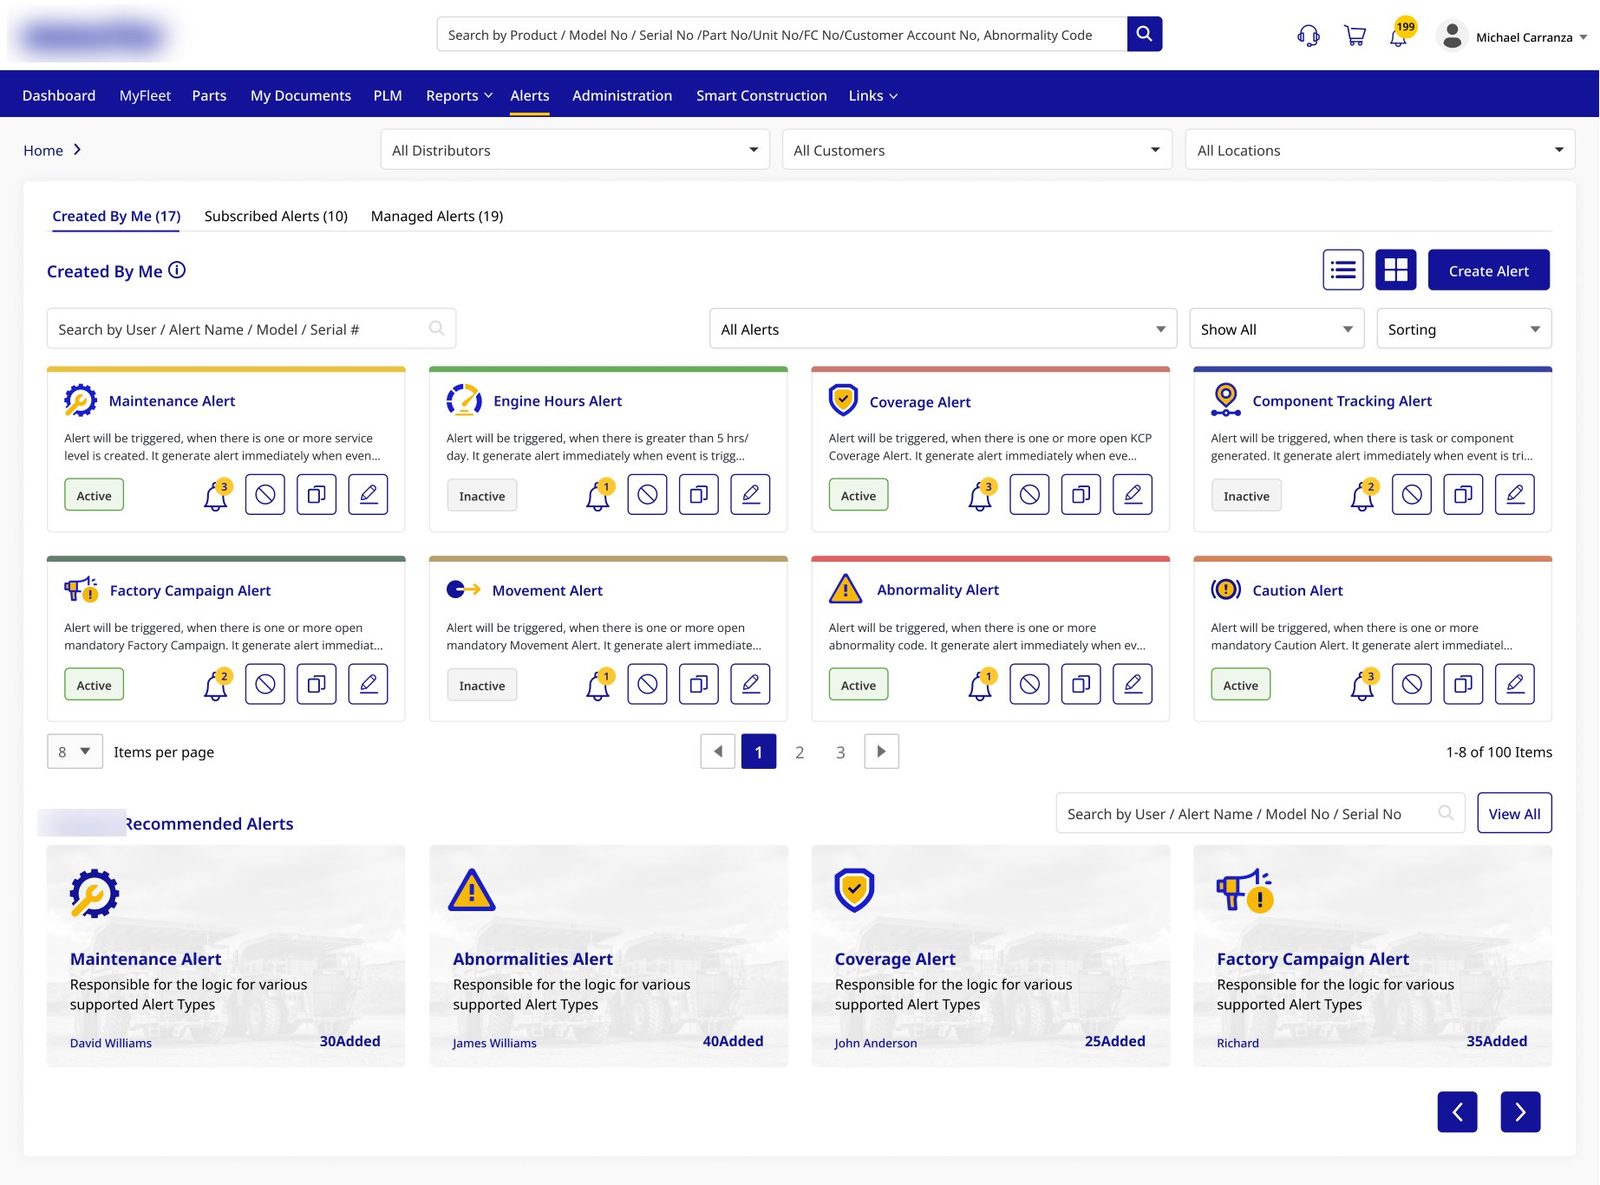
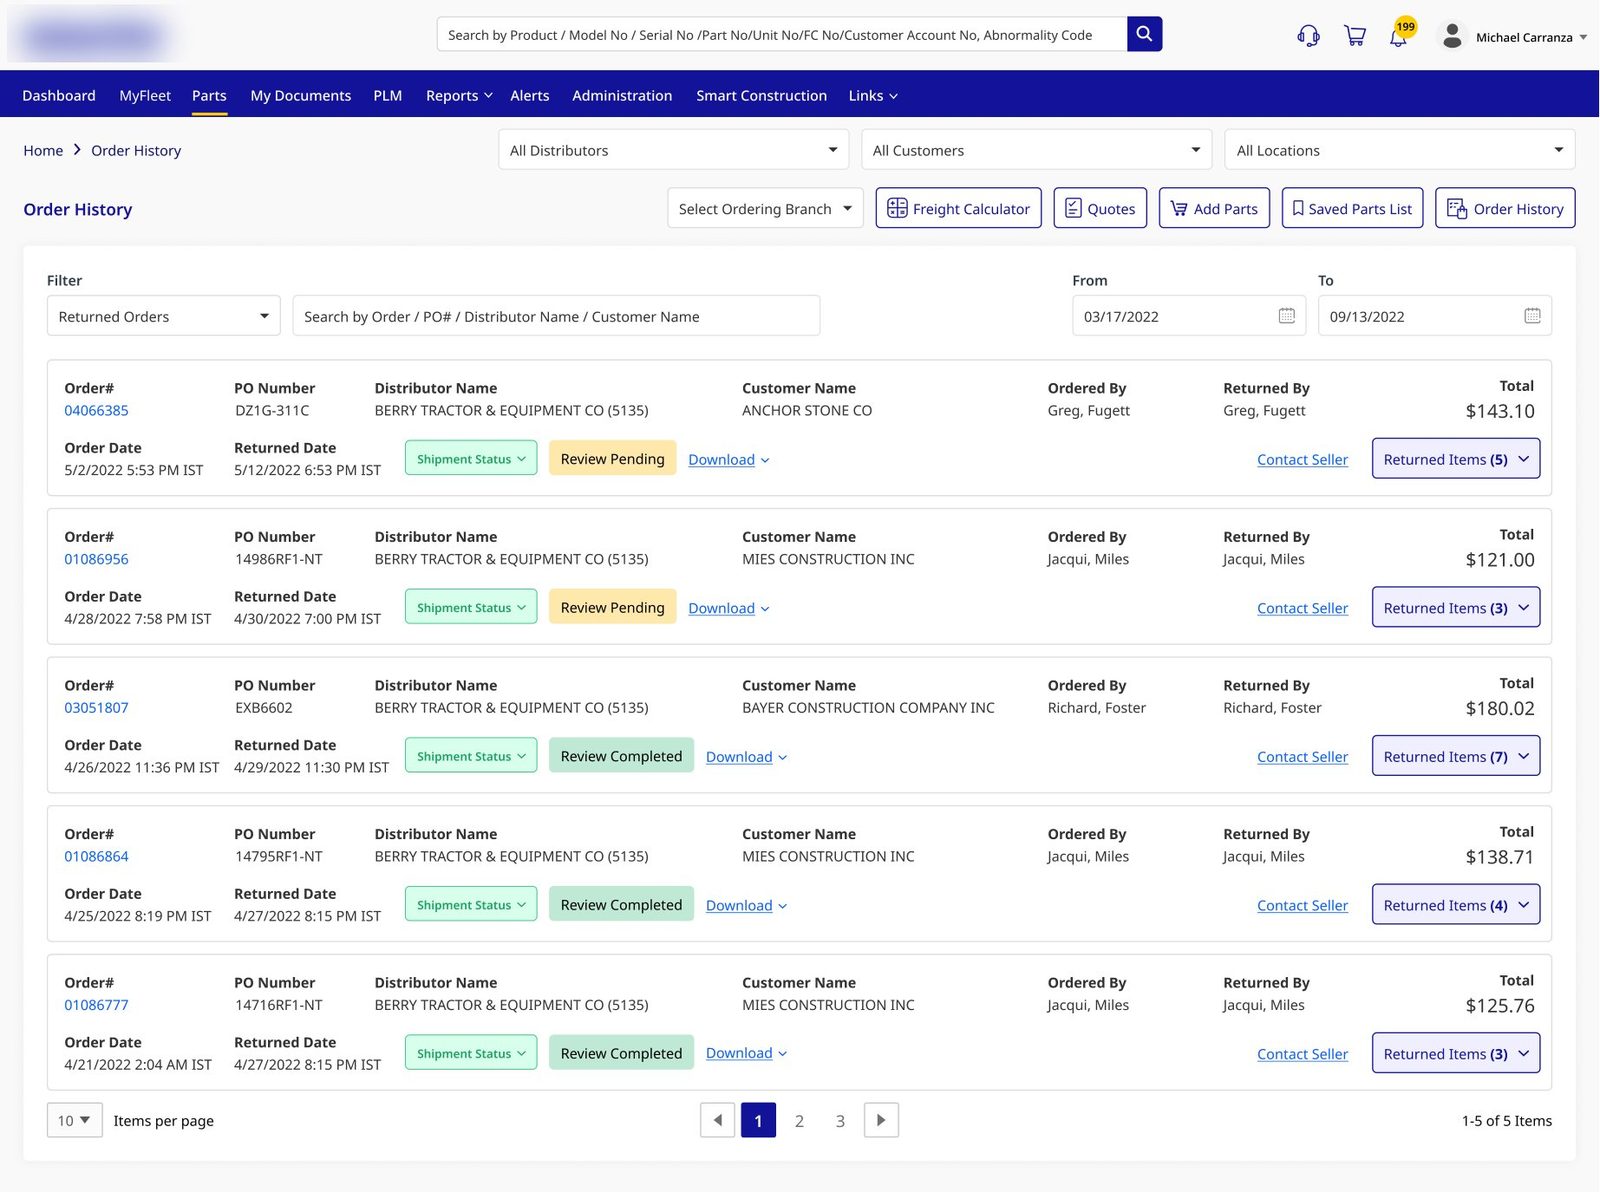
Six moments that carry the product’s core loop — monitor → diagnose → act → resupply. Use the arrows to move between screens.
Client branding is blurred in all product screens for confidentiality.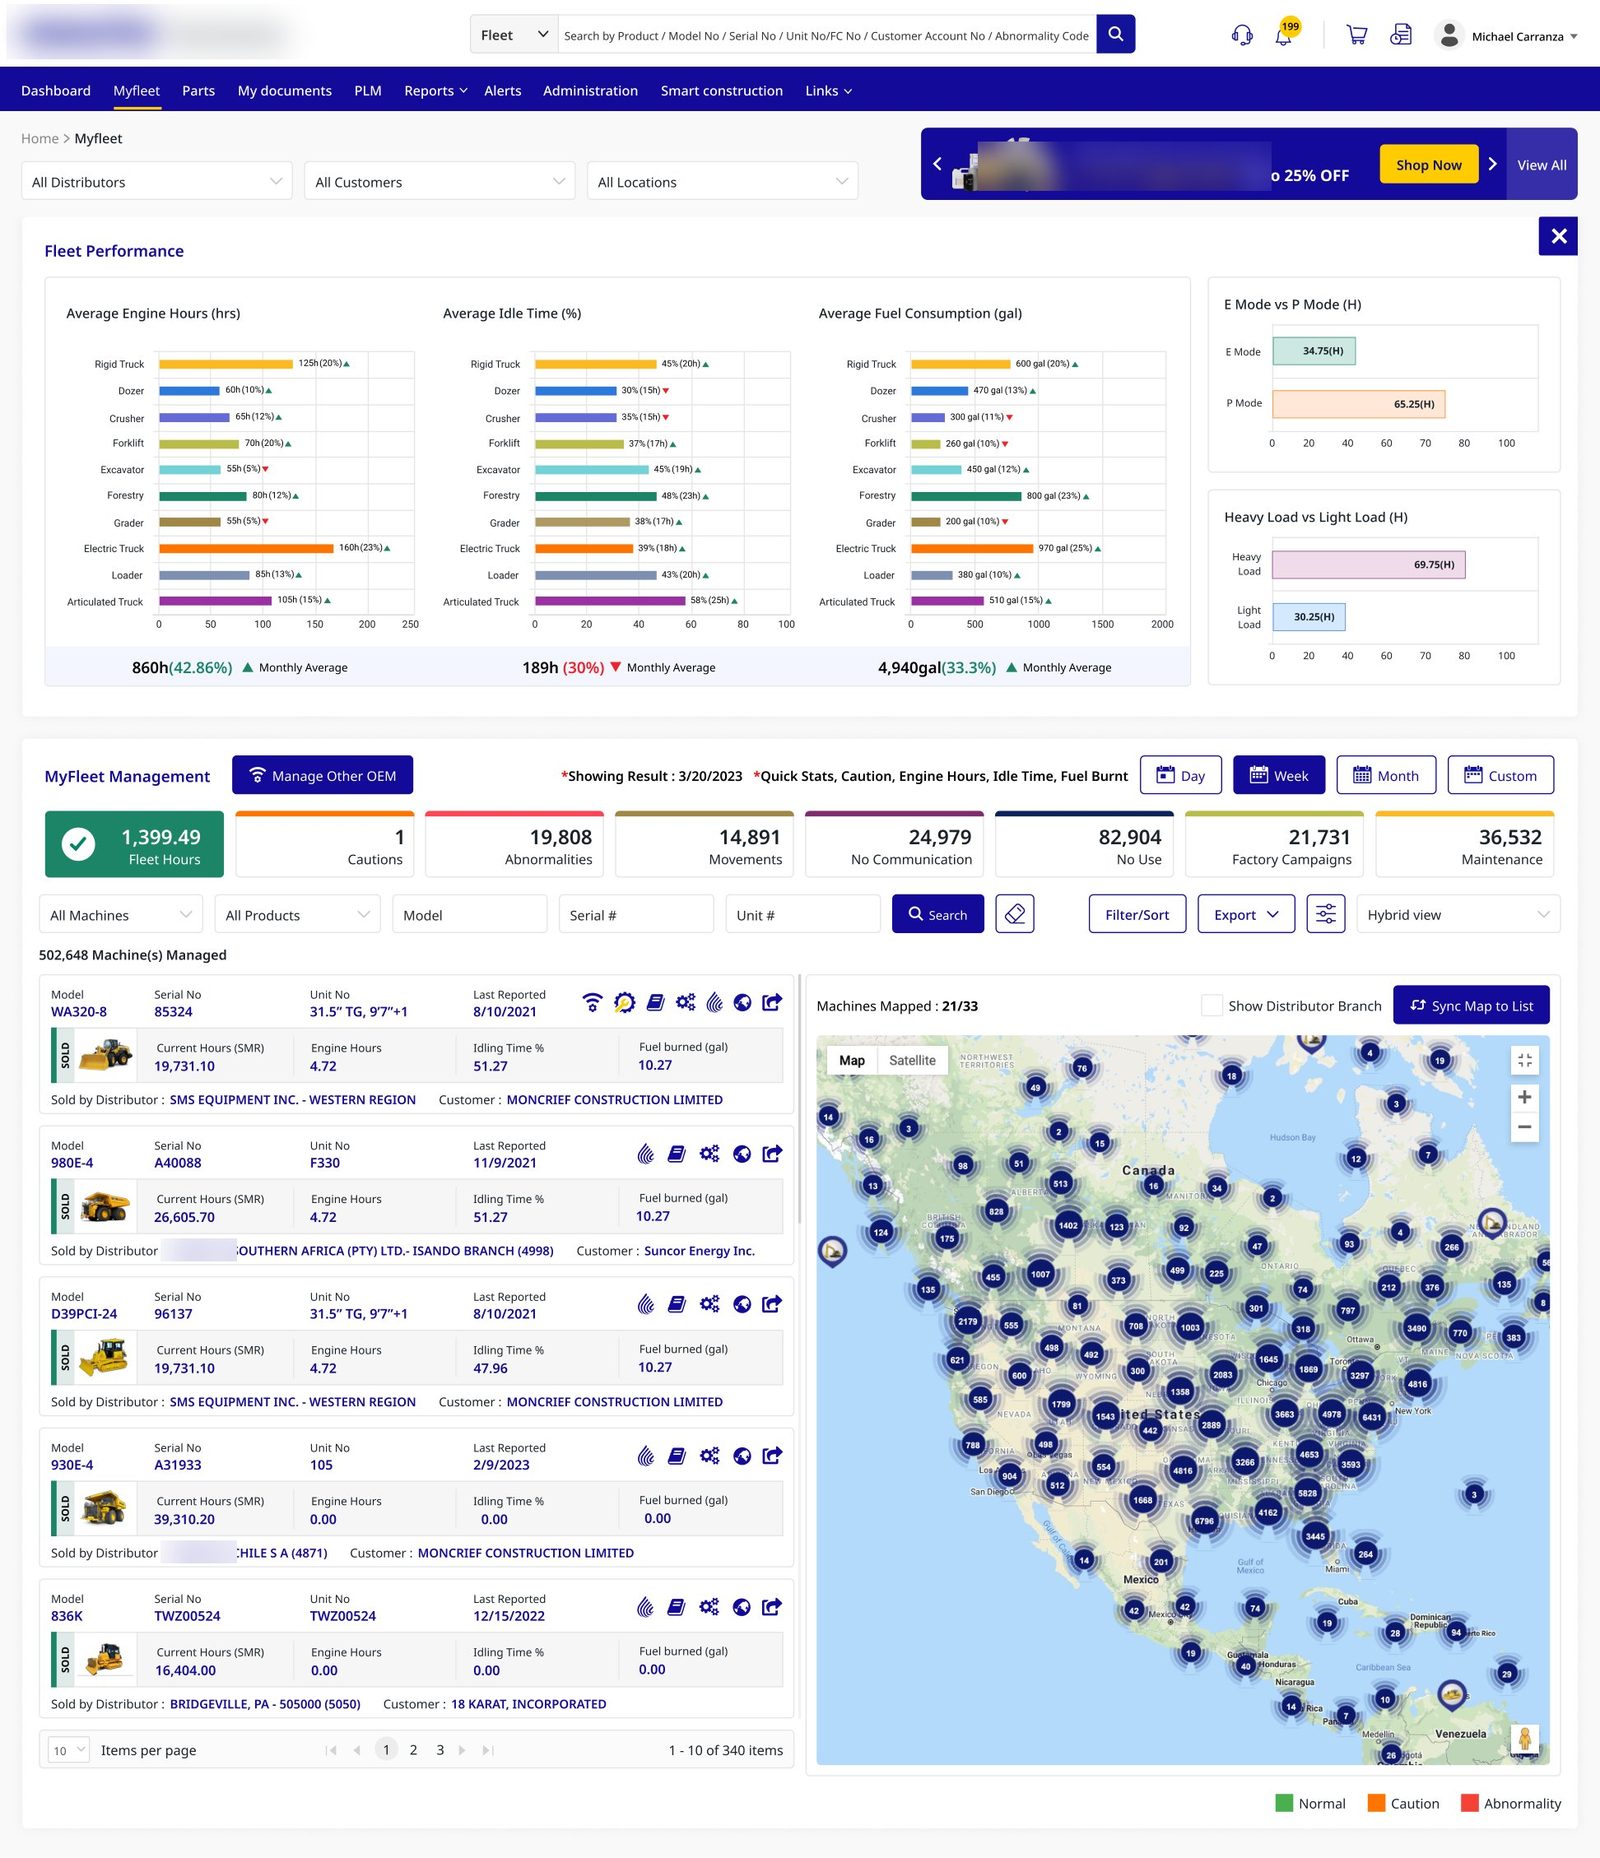
Four calls I’d defend again
Normal / caution / abnormality colors mean the same thing on a counter, a pin, a row flag and a machine banner. Operators trust color when it never lies to them.
One omnibox accepts model, serial, unit, FC number, customer account or abnormality code — because in the field, you search with whatever’s stamped on the chassis or the fault screen.
“Create alert” sits on the utilization chart; “order kit” next to oil-analysis data; recommended parts on the machine page. Action lives where the evidence is.
Utilization, reporting and location open as overlays on the machine — deep-diving without losing the patient on the table. Back-button anxiety eliminated.
End-of-shift report
Telematics, documents, alerts and the parts store now share a single shell — a fleet manager’s morning starts with one login, not four.
Composable alerts with escalation paths move failures from the field to the service bay — caught as thresholds, not breakdowns.
Recommended parts, service kits and saved lists connect diagnosis to purchase — keeping parts revenue with the distributor network.
The same drill pattern serves customers, distributor reps and OEM admins — including mixed fleets via other-OEM registration.
Enterprise IoT taught me that dashboards aren’t the product — decisions are. Half a million machines will happily bury you in charts; the design work is deciding which three numbers a person needs at 7am, and making sure the next click is an action, not another chart.
What this project left me with