


PRICING SHEET
An FX-derivatives pricing workstation — 100 strategies, live greeks and multi-scenario pricing on a sheet every desk can reshape for itself.
A pricing sheet that prices the way traders think
FX-derivatives desks quote structures all day — vanillas, straddles, butterflies, seagulls — against moving curves and vols. I designed the Pricing Sheet end to end as an interactive product concept: one workstation where a trader composes a strategy, prices scenarios side by side, reads the greeks at a glance — and reshapes the sheet itself to fit the desk.
Every desk prices differently — every tool assumes they don’t
Vendor pricers ship one fixed layout for every desk. So traders fall back to spreadsheets: stale curves, re-keyed trades, greeks in one tab and the market in another — and no control over who prices what.
Modern web UI, full feature parity
Admin-governed profiles decide what a desk can price; a trader-facing design mode decides how their own sheet reads — field by field or in bulk. Between them: live market data, multi-scenario columns and a solver, with the greeks always one glance away.
One screen, whole desk
Everything a pricing request needs sits in a single window — here’s the anatomy.
Rate curves (USD OIS, LIBOR), validation date & time, pricing environment, solver settings and leg links — the assumptions behind every number.
Vanilla, Spot, Forward side by side, each with Price / Save / Solve toggles and paired scenario columns for what-if pricing.
Delta, Vega, implied vol pinned beneath the trade — the risk reads in the same glance as the price.
Profiles, edit and design mode live in the header: the workstation is a product the desk can reshape.
The tape the legacy client printed
When the pricing tool doesn’t fit the desk, the desk routes around it — and these tickers start printing red.
The Swing grid showed every field for every product to every role — experts navigated by muscle memory, everyone else by fear.
Reshaping the sheet for a desk meant editing installer configs and raising IT tickets — so nobody did, and workarounds multiplied.
New joiners shadowed a senior trader to learn which fields mattered, which were dead, and which F-key priced — the UI taught nothing.
Version drift between desks, no access from anywhere else, and every upgrade a coordinated deployment event.
A quote is a race — price it before the market moves and the client hangs up. The tool has to carry the structure, the market and the risk in one screen, shaped exactly the way that desk works.
What “fast” means on a desk
Two numbers anchored every layout decision — set as explicit design targets against the legacy workflow.
Interactions to price a 3-leg structure
select strategy → fill legs → price · measured on the prototypeFreshness of the market behind a quote
age of curves & vols at the moment of pricingThree layers between chaos and a quote
The core idea: separate what a desk may price (governed), how the sheet reads (personal), and the act of pricing (fast). Each layer has its own owner and its own UI.
Profiles govern the desk
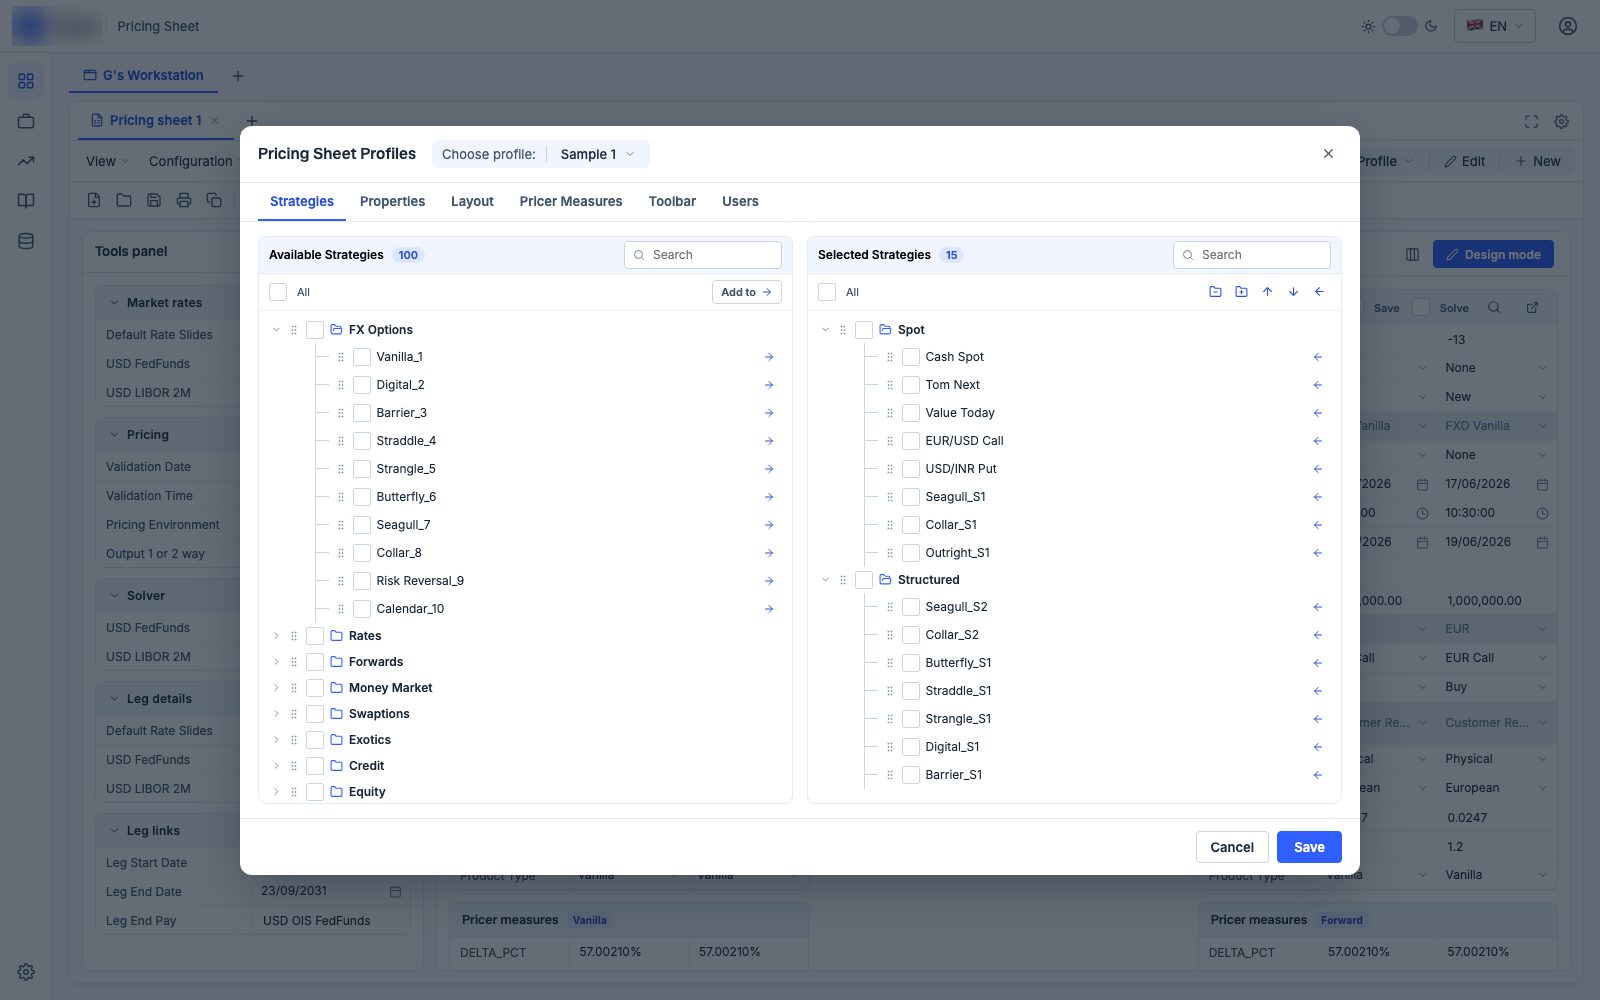
Six tabs decide what a profile exposes — curated from a catalog of 100 strategies across 8 asset classes, shared to user groups.
Design mode shapes the sheet
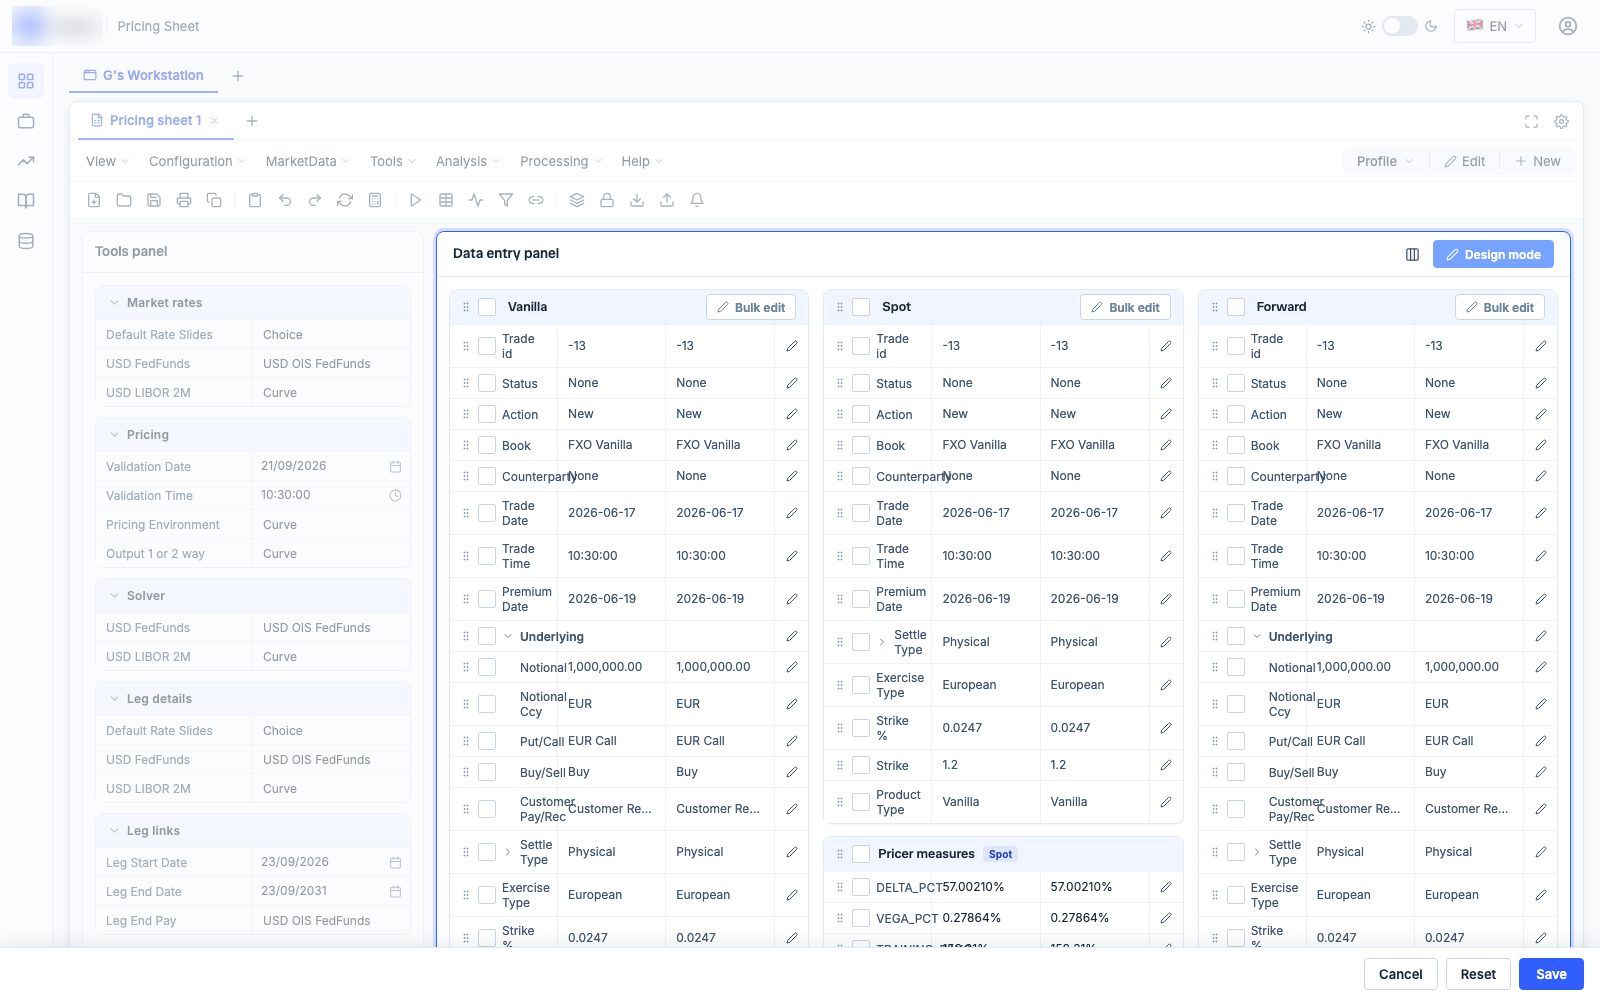
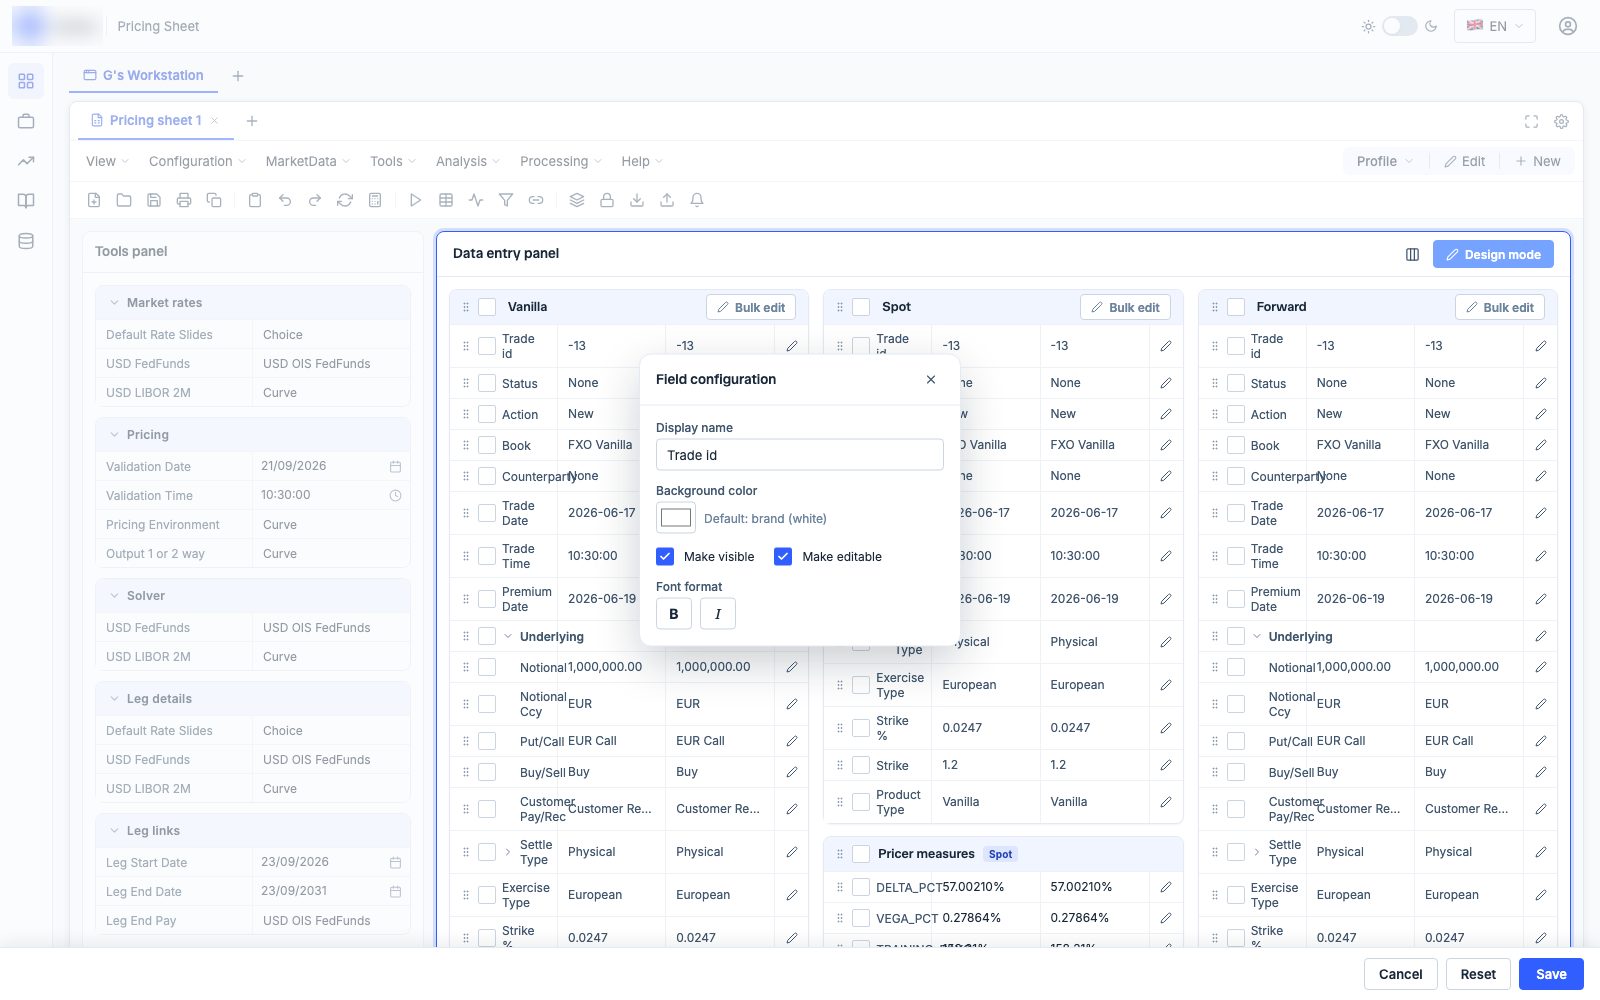
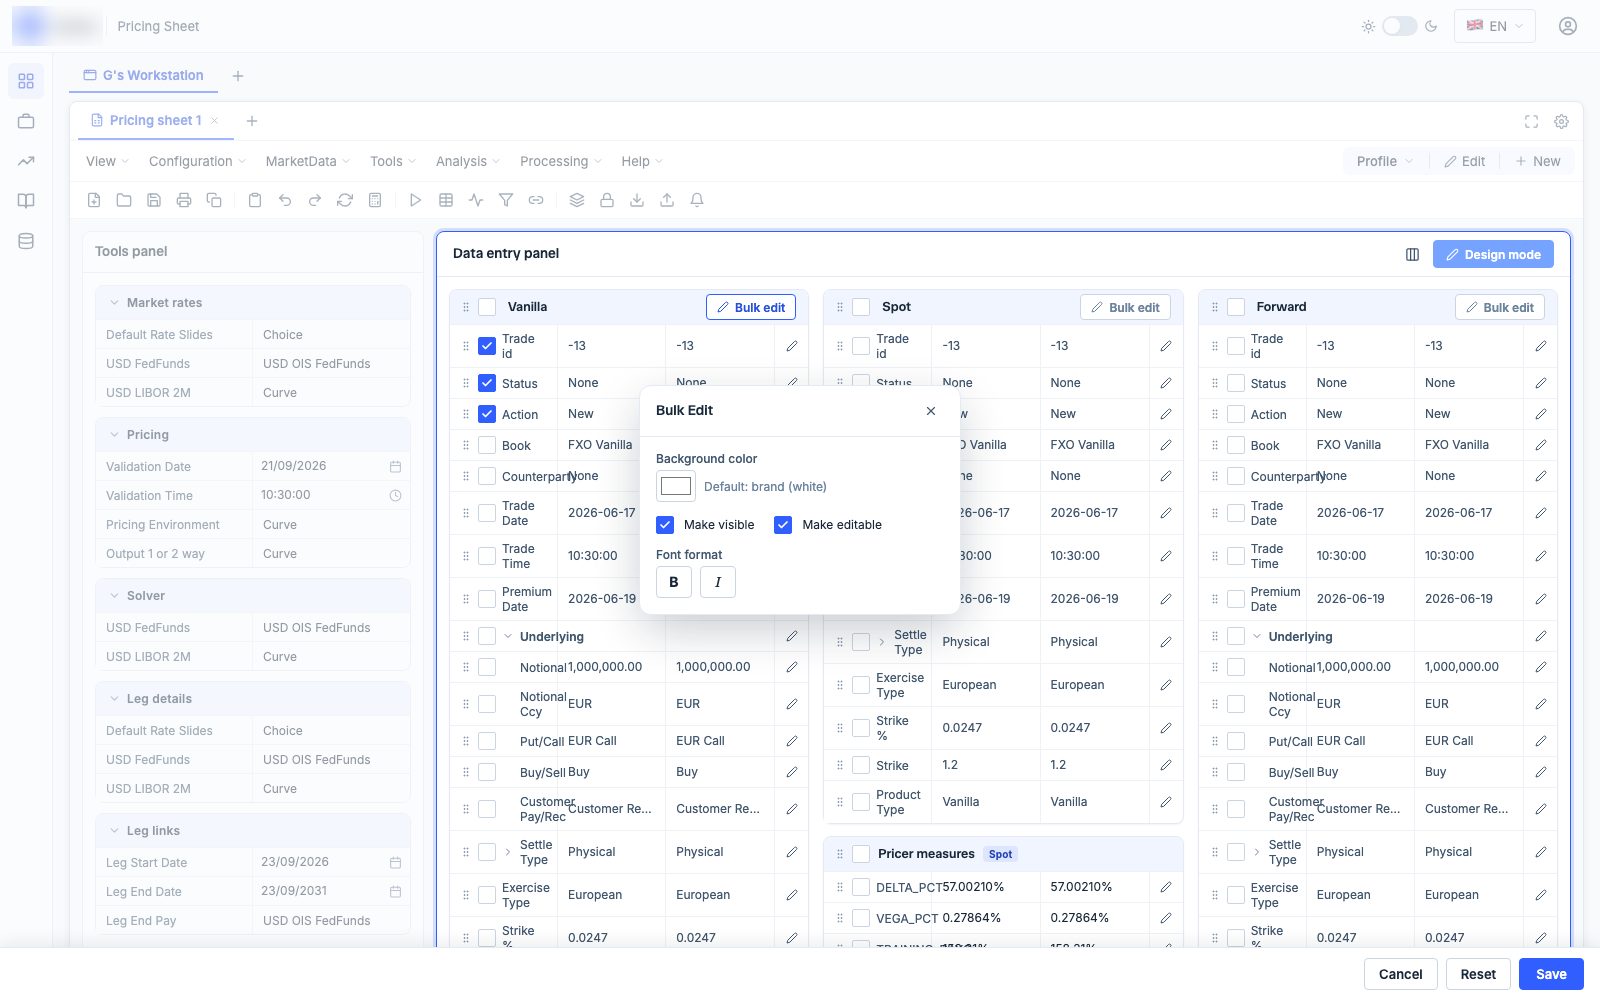
Rename, recolor, hide or lock any field — one at a time or in bulk — drag rows into the desk’s reading order, and save it as yours.
Scenarios price side by side
Each strategy column carries Price / Save / Solve toggles and paired what-if columns; greeks print underneath; the solver backs out the unknown.
The governance loop: what traders reshape in design mode can be promoted back into the desk profile — personal ergonomics become team defaults instead of private forks.
Inside a profile — the six tabs
A dual-list picker: 100 strategies across 8 asset classes on the left, the desk’s own grouped, ordered set on the right — folders, reordering and search built in.
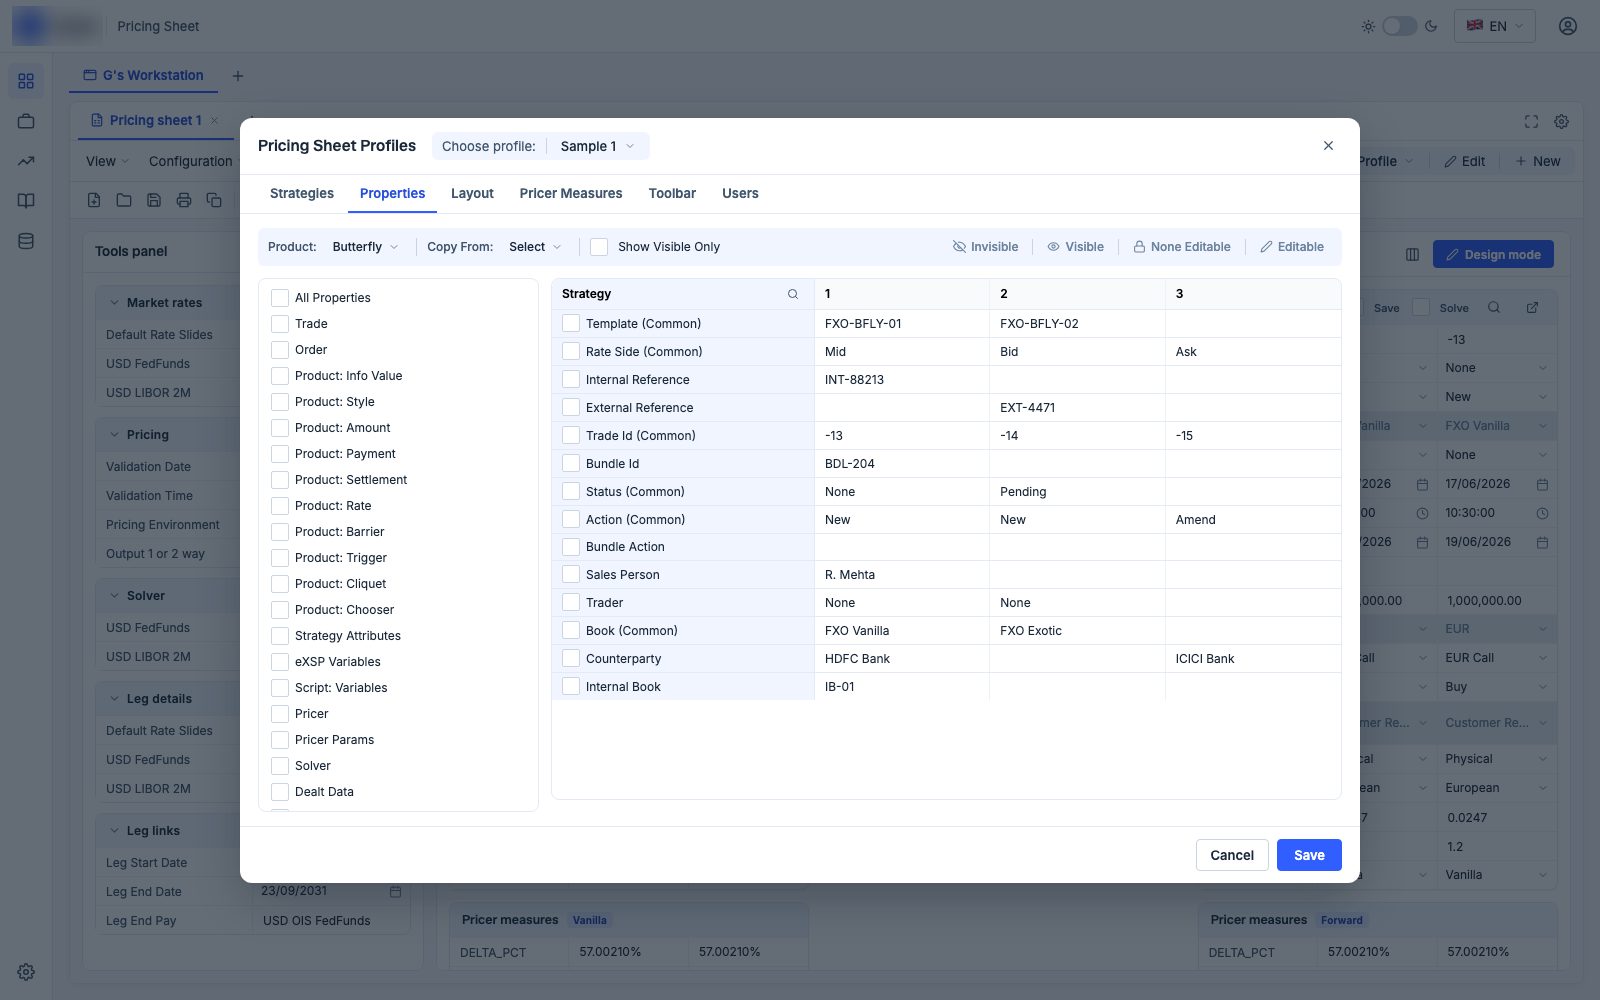
A per-product matrix of every field across strategy columns — flip visibility and editability in bulk, or copy the whole setup from another product.
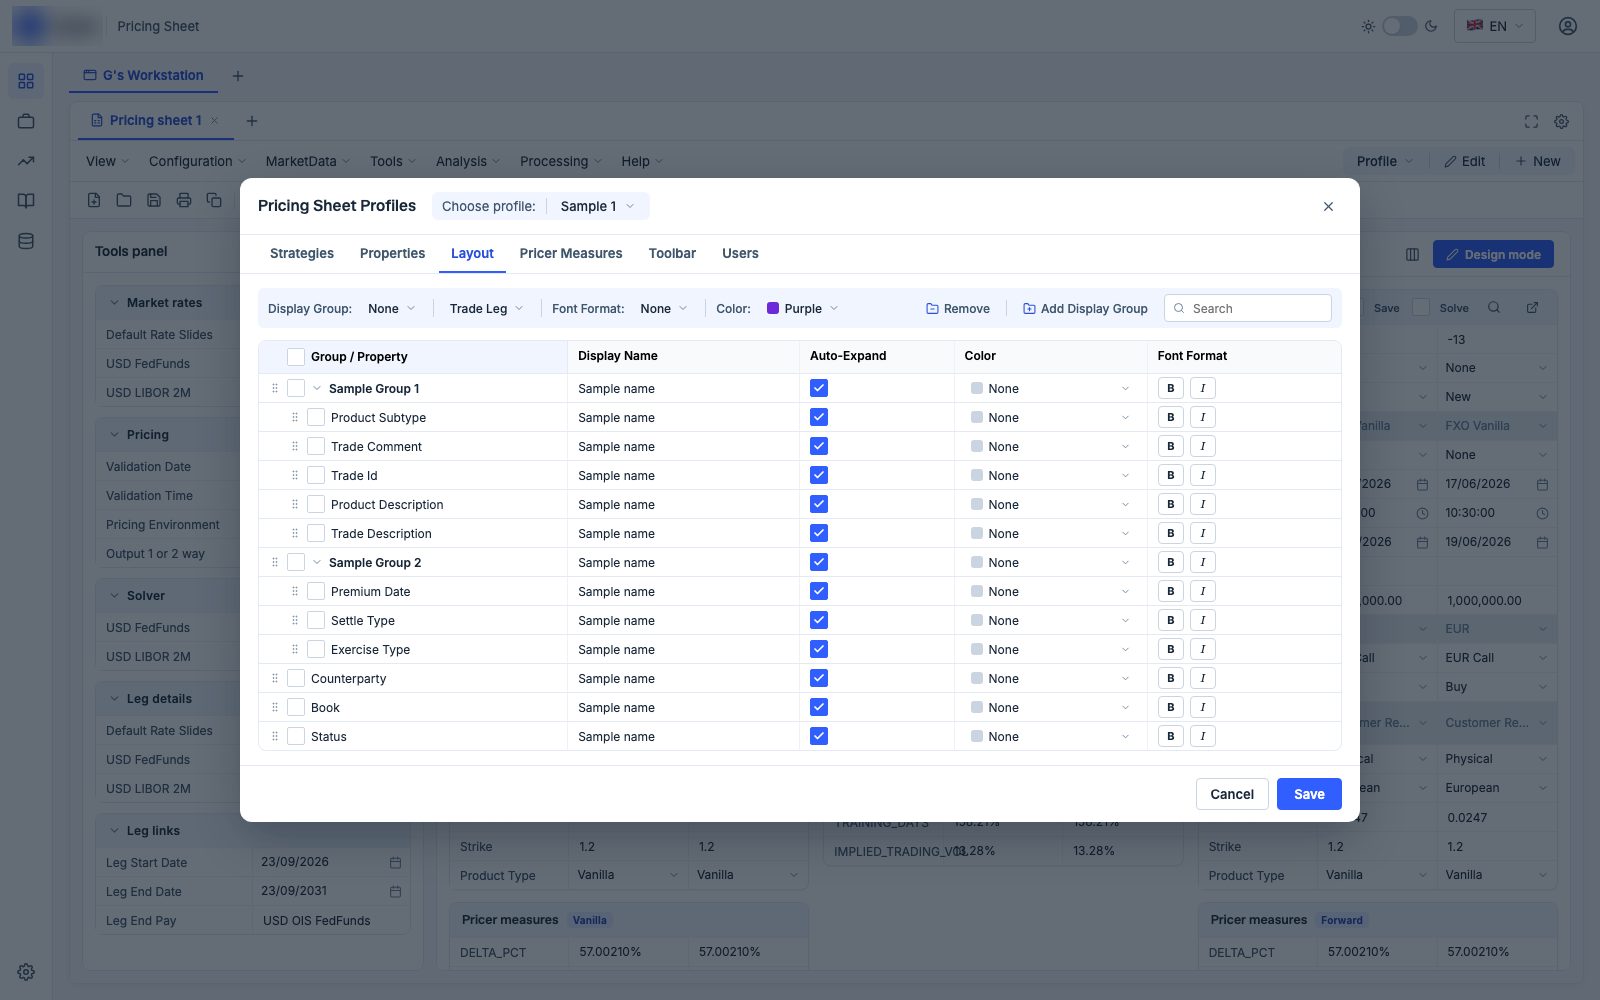
Display groups decide the reading order: each group and field gets a display name, auto-expand behavior, a color and bold/italic formatting.
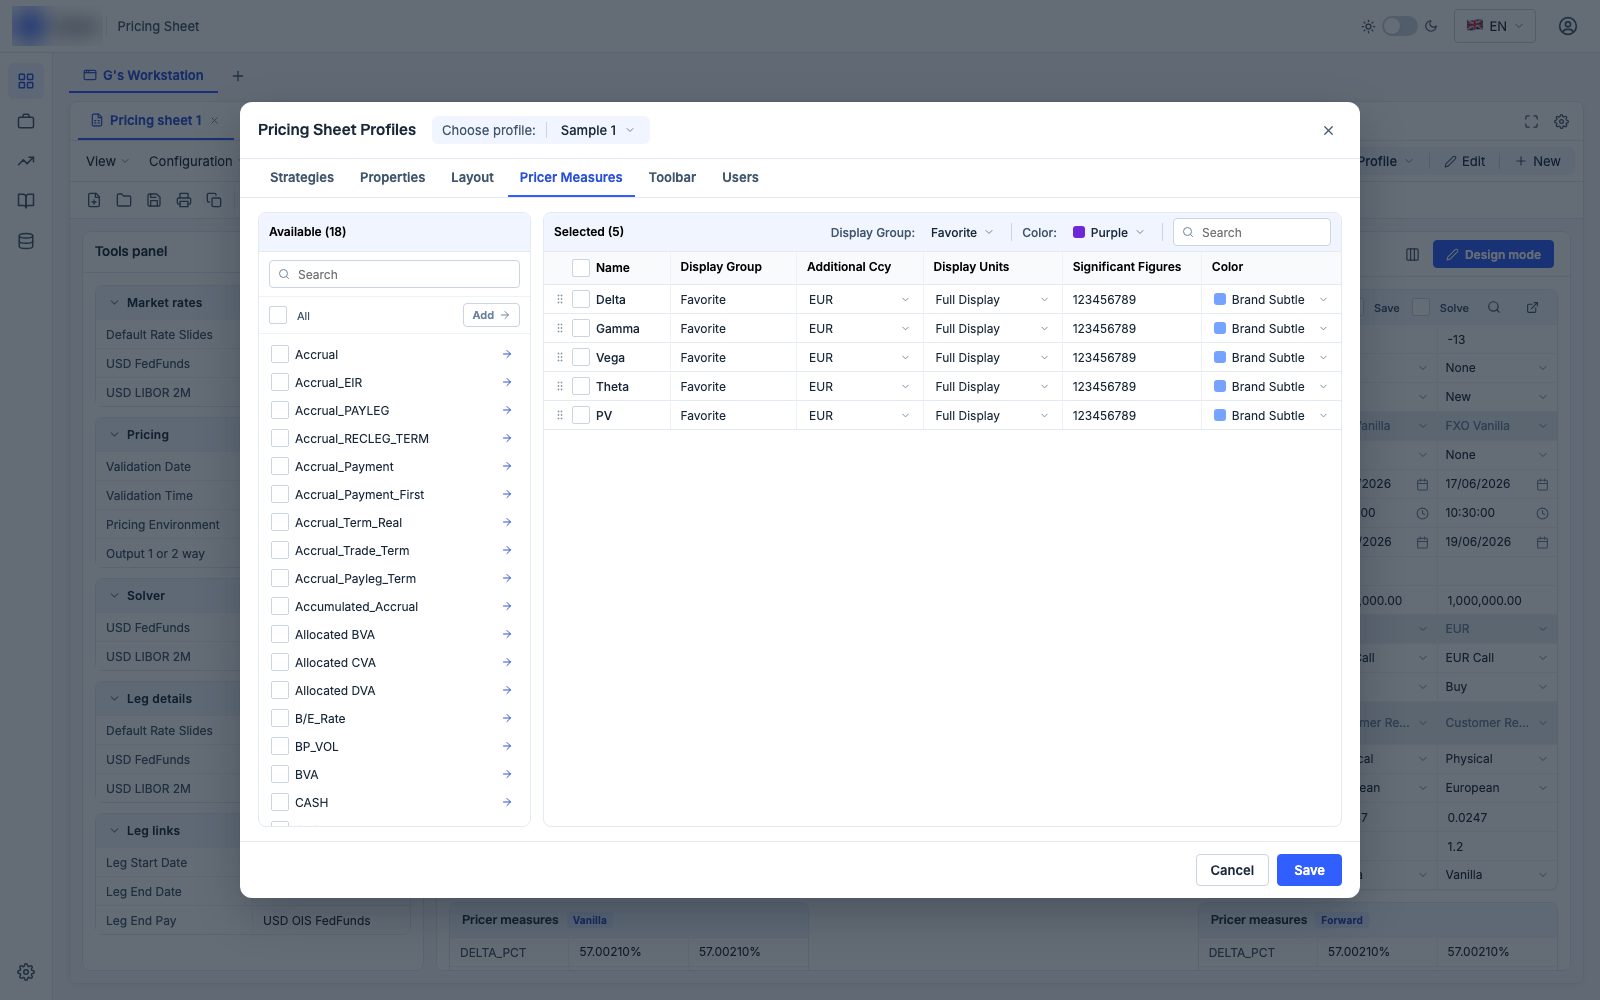
18 measures available, curated to the desk’s five — each with its own currency, display units, significant figures, color and display group.
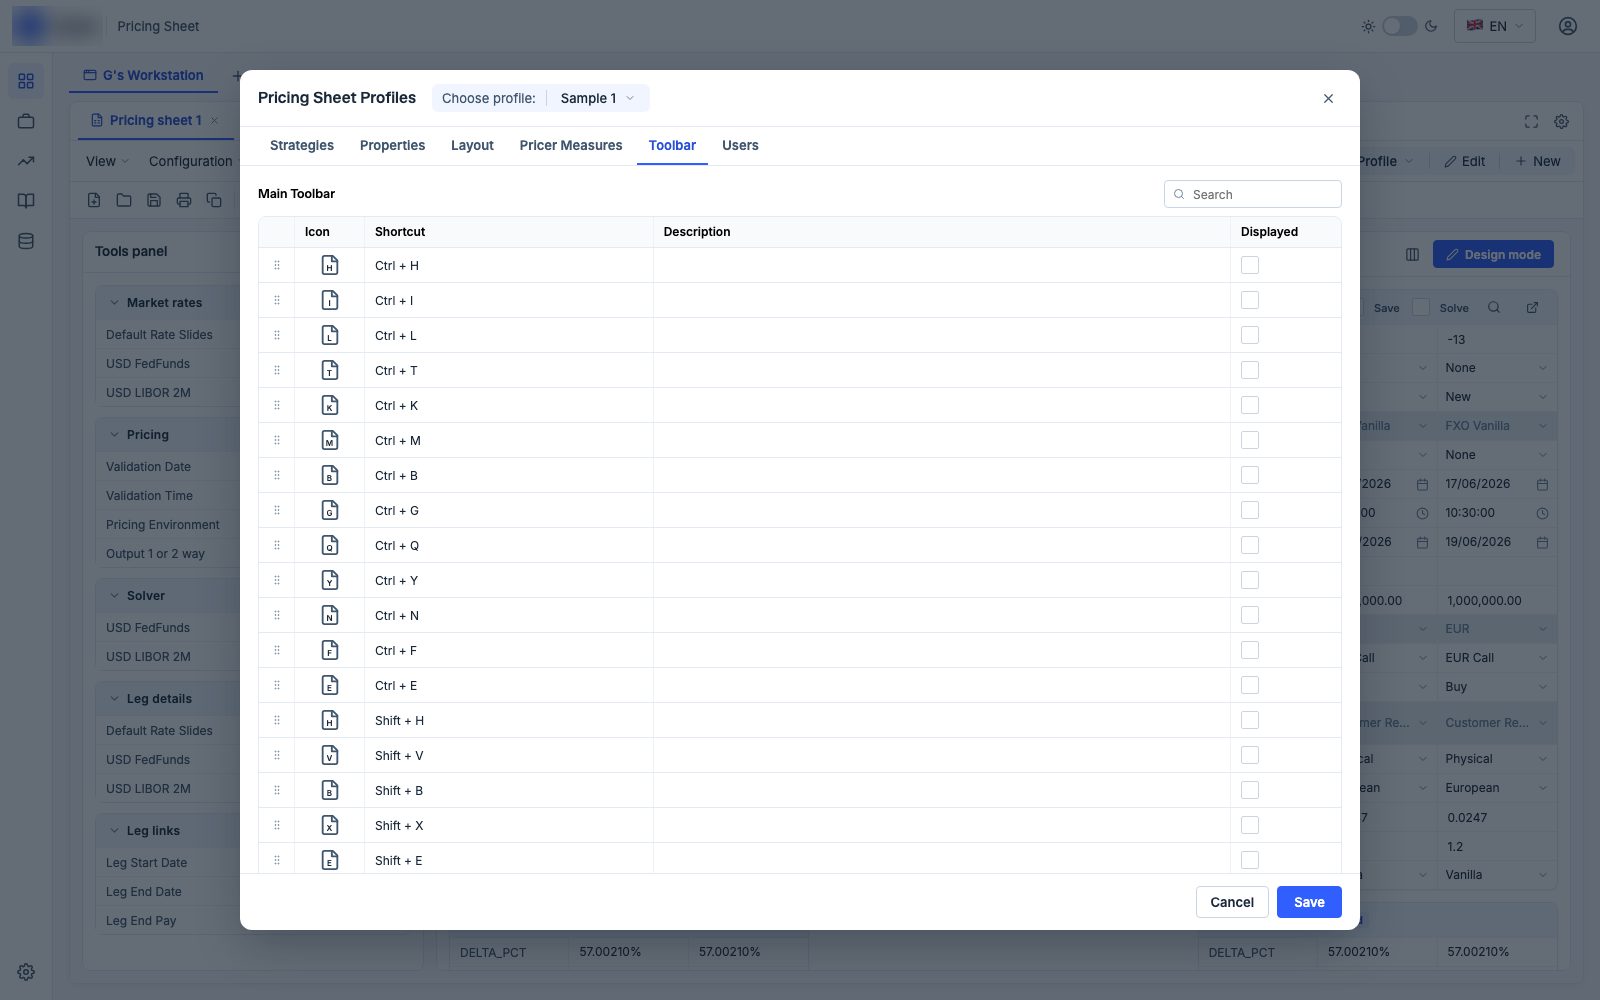
Every action listed with its keyboard shortcut (Ctrl and Shift chords) and a shown/hidden toggle — plus quick-fields like Trade Comment and Trade Id on the price & save bar.
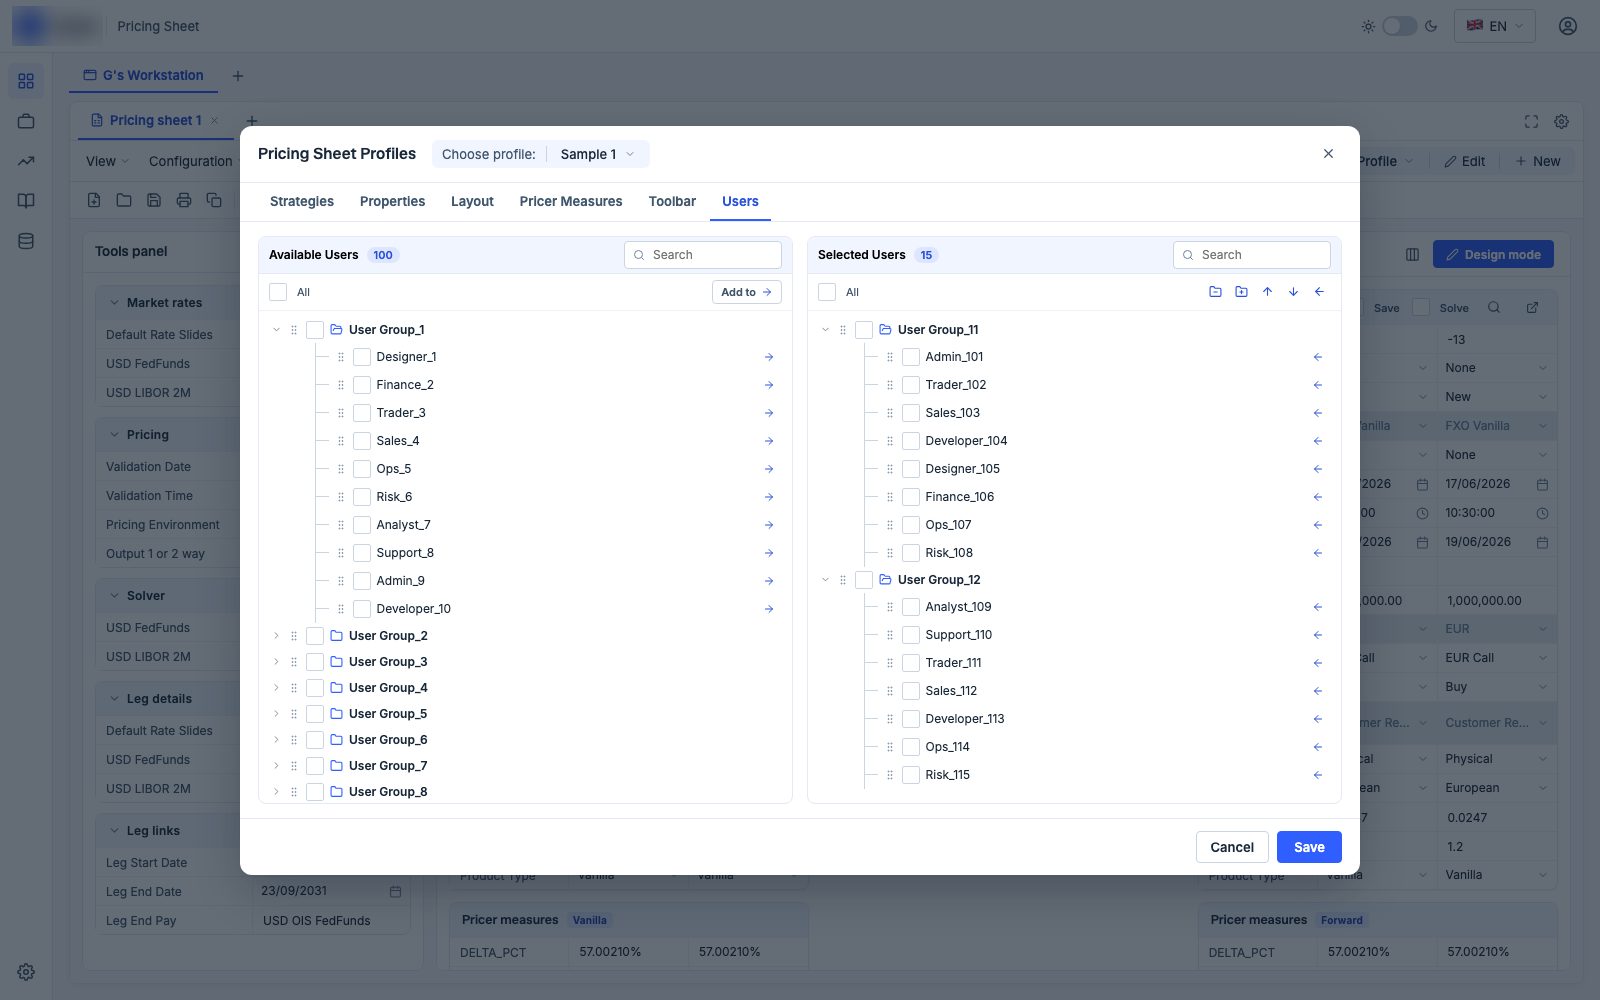
Profiles are shared to user groups — traders, sales, ops, risk — so each role opens a sheet shaped for its job, not a one-size default.
Every legacy feature found a new home
We inventoried the legacy client function by function, then mapped each pattern to a home in the new design — nothing was dropped, only re-housed and made discoverable.
All products, all roles, one fixed table.
Display groups fold the sheet to what this desk reads — the rest is one click away, not gone.
Per-desk installer configs nobody dared touch.
Strategies, properties, layout, measures, toolbar and users — edited in a dialog, shared to groups.
Local tweaks that died with the workstation.
Rename, recolor, hide, lock and reorder per trader — saved, governed, promotable to the desk profile.
Muscle memory that made experts fast — and new joiners slow.
Every action keeps a chord (Ctrl/Shift), each visible on the toolbar — speed for experts, discoverability for everyone else.
Comparing books meant a second install.
A desk’s whole book in one browser tab — sheets multiply without deployments.
Accurate, and unreadable at trading speed.
Greeks as configured display objects — units, currency, significant figures and color per measure.
The parity rule we held: no feature was removed until desk walkthroughs proved it dead. Features moved homes and gained hierarchy — they didn’t disappear. That’s what kept the traders who knew the old client on our side.
Four tickets I wrote against the defaults
Who owns the layout?
Admins govern the catalog and defaults; traders reshape their own copy field by field. Both are first-class UIs, not INI files.
Cheapest to build — and exactly why desks abandon pricers for spreadsheets.
How does a structure start?
Straddles, butterflies, seagulls, collars arrive pre-legged from the profile’s strategy tree — grouped and ordered by the desk.
Maximum flexibility, maximum re-keying — the 40-step path the targets were set against.
Where do the greeks live?
Delta, Gamma, Vega, Theta, PV — each with its own currency, units, significant figures, color and display group, pinned under every column.
Every measure the pricer emits, undifferentiated — accurate, and unreadable at trading speed.
One trade at a time, or the book?
Instruments price in paired what-if columns; selection checkboxes and bulk edit act on many rows at once; sheets multiply per workstation tab.
Simple mental model — but comparing two strikes means two windows and a memory test.
Greeks you can read at a glance
Live values from the prototype’s EUR call — shown the way the product treats them: as configured display objects, not raw pricer output.
From a Java desktop client to the web
The legacy sheet was powerful and dense in equal measure — every field, always, for everyone. The modernization had to keep the power and lose the noise.
Everything, everywhere, all at once. Strip columns to the horizon, two rows of thirty tiny icons, a strip generator, solver and leg links stacked down the left rail — and the “Pricing Sheet Profiles” dialog buried in the Configuration menu. The power was all there; only veterans could find it.
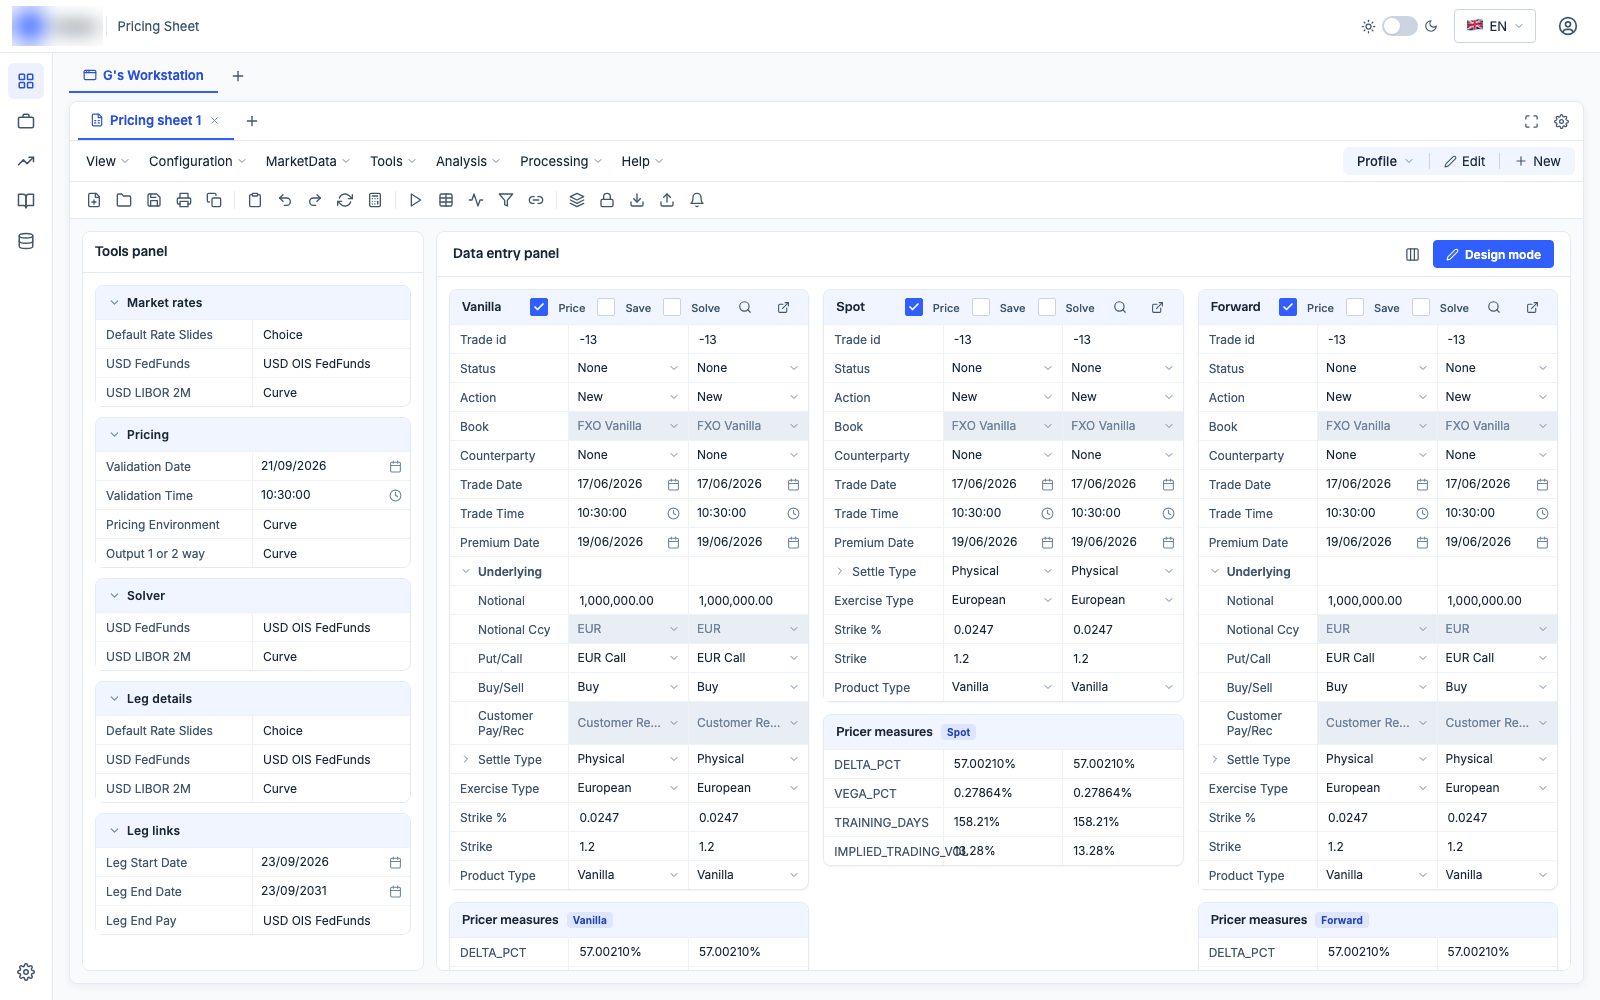
The same power, disclosed progressively. The features didn’t shrink — the noise did: collapsible groups, profiles per desk, design mode per trader, and a browser tab instead of a desktop install. The modern profiles dialog is the legacy one’s direct descendant.
Ten screens through the workstation
The interactive prototype, from the live sheet to the deepest configuration tab — use the arrows to move between screens.
End-of-day summary
Across 8 asset classes — FX options, rates, forwards, money market, swaptions, exotics, credit, equity.
Strategies, properties, layout, measures, toolbar and users — the whole desk governed from one dialog.
Admin profiles for governance, trader design mode for ergonomics — nobody needs a spreadsheet fork.
Delta, Gamma, Vega, Theta, PV as configured display objects — 18 measures available on search.
Every toolbar action mapped and remappable — the sheet keeps up with two-hands-on-keys pricing.
Tabbed workstations and sheets — a desk’s whole book, one window.